Hi, I’m Ian Wu

Software, Automation & Data

Specializing in Software, Automation, and Statistical Analysis with Python, Java, JavaScript, and R

About Me

My Computer Science studies at the Open University have covered software development, automation and data analysis. This portfolio brings together practical projects and statistical demonstrations, with source code where available.

I work primarily with Python, Java, and JavaScript, with additional experience in R for statistical analysis. I’ve been tinkering with computers for 20 years, and I bring that hands-on curiosity to technical projects, emphasizing problem-solving, agile workflows, and user-centric delivery. I’m seeking opportunities in software development or automation engineering.

Studying
Computer Science, Open University
Experience
20 years tinkering with computers
Core languages
Python · Java · JavaScript · R

Projects

Featured project

Global CO₂ Analysis

Interactive Plotly charts of emissions over time, country rankings and per-capita emissions, using Our World in Data.

  • Input pinned to a specific OWID dataset revision, with its SHA-256 checksum recorded for reproducibility
  • World, regional and income-group aggregates excluded using ISO 3166-1 country codes
  • Unit tests on synthetic fixtures, run by GitHub Actions on Python 3.11 and 3.12
  • Python
  • pandas
  • Plotly
  • pycountry
  • unittest
  • GitHub Actions
Top 5 CO₂ emitters, 2022 Annual emissions, million tonnes (Mt)
  1. China11,712 Mt
  2. United States5,055 Mt
  3. India2,831 Mt
  4. Russia1,675 Mt
  5. Japan1,030 Mt

Source: Our World in Data CO₂ dataset, as ranked by this project. Countries and territories only.

Synthetic Time-Series Forecasting

Synthetic data

A Python teaching demonstration using synthetic COVID-shaped counts. Includes an ARIMA forecast and held-out error measurements. These are simulated observations, not real COVID-19 data.

  • Python
  • Pandas
  • Statsmodels
Synthetic daily cases and deaths with an illustrative ARIMA forecast

Synthetic Economic Regression

Synthetic data

An R demonstration of correlation and linear regression using 200 synthetic inflation and unemployment observations. The data are generated locally; the results do not establish real economic relationships.

  • R
  • ggplot2
Synthetic inflation and unemployment observations with a regression line

Interactive Regression Playground

Try it yourself

Click the chart to add a point, or click a point to remove it. The least-squares regression line and statistics update instantly, calculated in your browser with plain JavaScript using the same ordinary least-squares method as the R demonstration above.

Points (n)
—
Slope
—
Intercept
—
Correlation (r)
—
R² (variance explained)
—

Other Projects

Real-Time Crypto Trading Bot

JavaScript app using WebSockets to stream live Binance market data and compute RSI-based buy/sell signals. UI for price charts, holdings, and trade history.

  • JavaScript
  • WebSocket
  • Binance API

Rebuilt 

Pong Game (Pygame)

Classic Pong game built with Pygame. Collision detection, score tracking, input handling. OOP structure for maintainability.

  • Python
  • Pygame
  • OOP

Rebuilt 

OOP Calculator (Java)

Functional calculator in Java applying encapsulation and inheritance. Clean structure for future features and UI improvements.

  • Java
  • OOP
  • BlueJ

Rebuilt 

Reproduce the Demonstrations

All statistical examples on this page use synthetic data. Read the current summary for the methods, data generation and limitations.

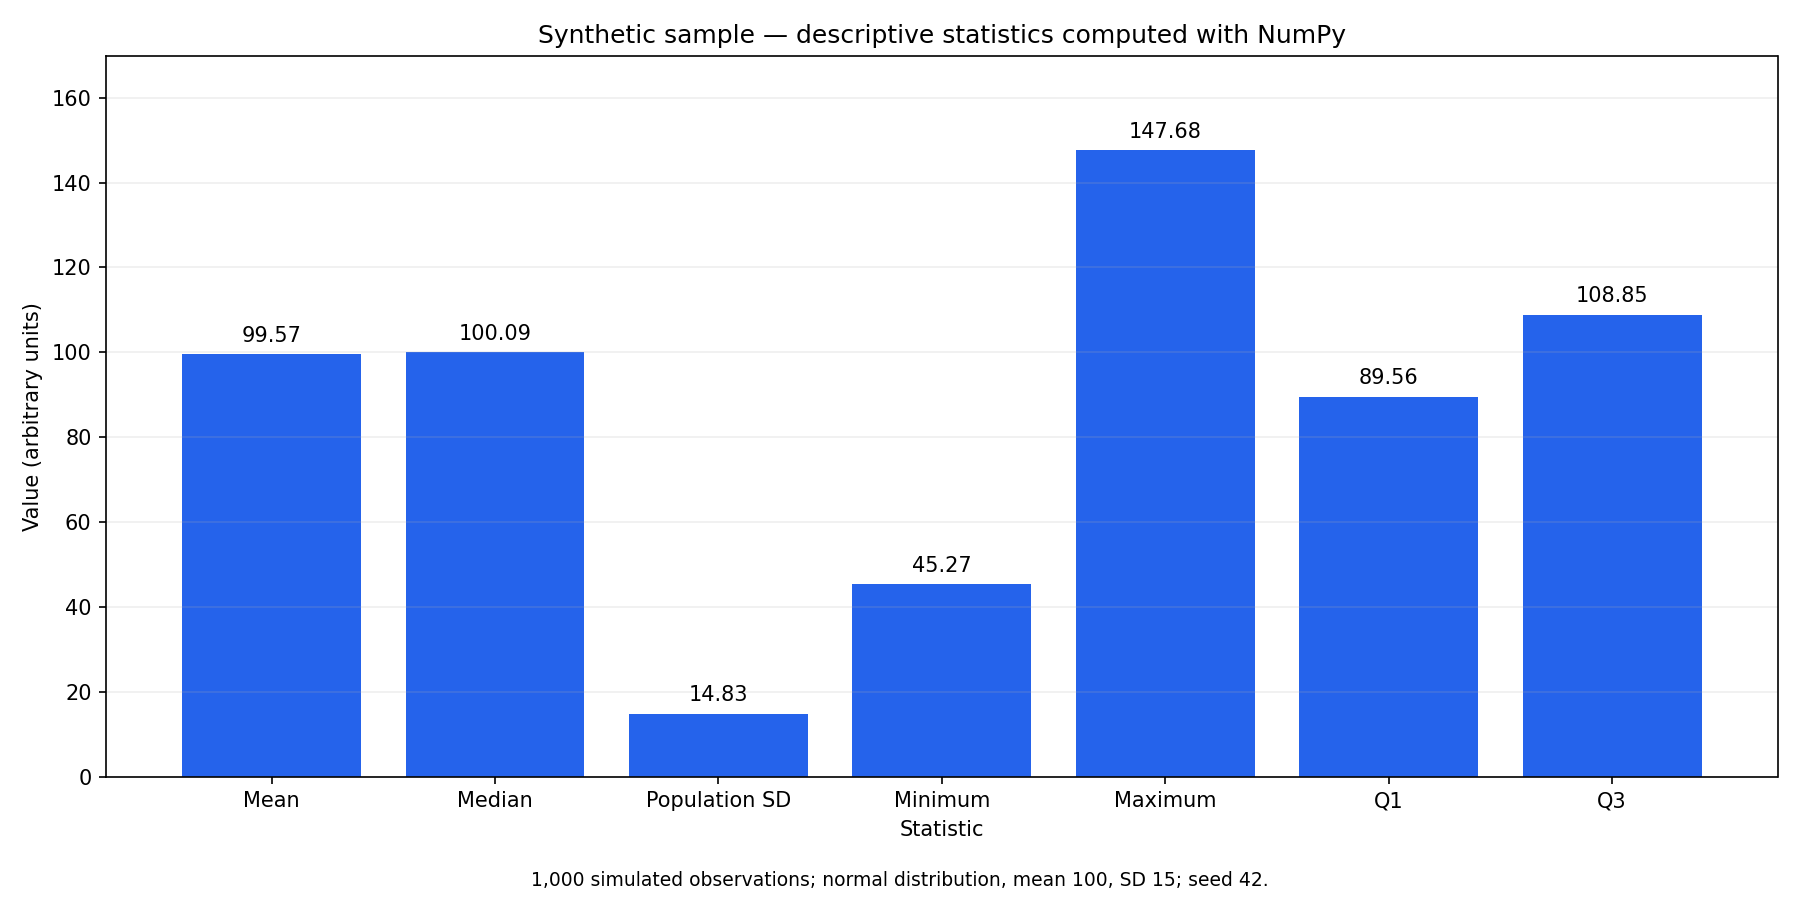
Descriptive Statistics with Python/NumPy

A seeded synthetic sample of 1,000 observations, with population standard deviation and quartiles computed in NumPy.

NumPy descriptive statistics for a synthetic sample: mean, median, population standard deviation and quartiles

Skills & Technologies

Programming

  • Python
  • Java
  • JavaScript
  • R
  • HTML/CSS

Frameworks & APIs

  • Pygame
  • Node.js
  • React (learning/working knowledge)
  • RESTful APIs
  • WebSocket / Binance API

Tools & Concepts

  • Git, Jira (or similar)
  • SPSS, Minitab
  • OOP, Data Structures & Algorithms
  • Data Analysis, Statistical Modeling
  • Agile methodologies

Education & Certifications

Education

Computer Science studies (BSc programme) — Open University

Relevant coursework: Algorithms & Data Structures, Software Engineering, OOP, Web Development

Certifications

  • Google Cybersecurity Professional Certificate V2, 2025
  • Google IT Automation with Python Specialization, 2023

Get In Touch

Interested in collaborating or have a question? Feel free to reach out!